benchy/¶
Fair in-browser benchmarking of ML runtimes and frameworks: TensorFlow.js,
ONNX Runtime Web, LiteRT.js, Transformers.js, MediaPipe Tasks, ML5 — measured
on identical inputs with strict methodology, capability detection, and
schema-conformant result export. This is the production implementation of the
planned app and the consolidation target of the retired donor
apps ml-bench/ and auto-bench/ (archived documentation:
research/archive-donor-docs/).
Purpose¶
benchy/ is the single reference implementation going forward. It turns the
prototype explorations (prototype/,
ml-browser-check/, bench-proto/)
into a rigorous benchmark suite:
- 6 engines (3 runtimes × adapters + 3 framework wrappers) measured on identical inputs
- Capability detection that gates which engine × backend combos are offered
- Strict methodology — warmup + median iterations, cache-first model loading, validity flags
- Fully offline by design — every runtime asset self-hosted, zero third-party requests (enforced by e2e)
Current State¶
| Property | Value |
|---|---|
| Status | Complete (consolidation phases done) |
| Stack | React 19 + TypeScript on Vite 8, Tailwind v4, zustand + IndexedDB, Zod v4, Recharts |
| Package manager | bun |
| Testing | Vitest (per-directory coverage gates) + Playwright e2e incl. real-inference offline proof |
| Hosting | Requires COOP/COEP headers for cross-origin isolation |
Implementation plan: research/plans/impl-plan-benchy.md (repo; amendments live in
research/plans/impl-plan-mlbench.md). Runtime audit:
research/audit-benchy-runtimes-aug-2026.md (all 12 findings fixed and verified).
Validation gate evidence: research/validation-gate-benchy.md (7 engines — onnx f32 and i8,
litert, tfjs, transformers q8, mediapipe classification + segmentation, ml5 — each completing
with ≥30 measured runs on Chromium and Firefox, 14/14; WebKit runs the main-thread engines,
with ORT-on-WebKit confirmed against the production deploy per benchy/e2e/README.md).
Capability subsystem (successor of ml-browser-check)¶
The capability detection from ml-browser-check/ was re-architected into
src/core/capability/ as a subset optimized for the benchmark pipeline —
detection breadth was traded for methodology rigor and integration:
| Module | Role |
|---|---|
probe.ts |
WASM (SIMD/threads/WasmGC/Mem64 via validated probe binaries), WebGL2 (ML-relevant extension filter, masked-renderer handling), WebGPU features + adapter limits and adapter info (custom-model viability), WebNN backends. Split into initLevelProbe() (page init, no consent) vs fullCapabilityProbe() (runs automatically on first site load) |
computeInfo.ts |
CPU cores/arch/memory, GPU class ½/3 heuristic (class/vendor/type/accuracy), NPU detection, browser/OS parsing, platform class |
limits.ts |
Pure custom-model viability guard: compares model size against maxStorageBufferBindingSize/maxBufferSize — the Playground warns (non-blocking) when an uploaded model exceeds the GPU's WebGPU buffer limits |
microBench.ts |
4 worker-based matmul micro-benchmarks (WASM SIMD/MT, WebGPU, WebNN) at fixed 512×512, uniform 3 warmup + 10 measured median ladder, tier ½/3 by GFLOPS (≥10 / 1–10 / <1). WebGL2 and WASM-scalar ladders were dropped: the WebGL2 GFLOPS is untrustworthy at 512 (sub-ms runs collapse to the 1ms-floor value), and scalar is redundant with SIMD for tier purposes |
Capabilities page layout: 3×2 compute summary (Agent | CPU | GPU /
NPU | Cross | JSPI) — the WASM feature flags (SIMD/threads/GC/mem64) live in a
chevron-expandable inside the CPU card, the WebGPU adapter limits inside the GPU
card (alongside the consent-gated exact-model eye toggle); then the 4 hardware-tier
cards; then the runtime×backend matrix with columns wasm | webgpu | webnn in
display order ONNX Runtime Web → LiteRT.js → TensorFlow.js (the cpu/webgl
columns were dropped as noise — cpu is always runnable, webgl is a legacy fallback
no thesis runtime dispatches to).
First-load experience: the full check runs automatically on first visit behind a splash overlay with real phase progress (probe + 4 benches) and a Skip button (check continues in the background; results persist to IndexedDB and pages hydrate when done). Check failures and local-persistence failures surface as dismissible banners instead of failing silently.
Carried over from ml-browser-check: WASM SIMD/threads/WasmGC/Mem64 probes, WebGL2 ML extensions, WebGPU/WebNN backend detection, WebGPU adapter limits + adapter info, GPU class + NPU detection, GFLOPS tier thresholds, throttle detection, JSON export, exact-GPU eye toggle (consent-gated display).
Simplified/dropped: WebGL1, WebNN 25-operator matrix (dead API —
navigator.ml.isOperatorSupported is not shipped in any browser), GPU
model/generation/year parsing (→ class heuristic; exact renderer string available
via the consent-gated fingerprint), environment extras
(OffscreenCanvas/ServiceWorkers/performance.memory detection), selectable matrix
sizes, Umami analytics (offline by design).
Added: Zod-schema-validated Capabilities/MicroBenchmarks, zustand + IndexedDB
persistence with 24h staleness, calibration gate, runtime×backend CapabilityMatrix,
unit tests + e2e, CSV/JSON export.
Privacy model (consent = export-time fingerprint gate)¶
The header switch governs only whether exported/submitted artifacts carry the identifying-device fingerprint block (exact browser version, user agent, exact GPU renderer). It is a setting, not a consent gate, and defaults ON:
- The fingerprint is collected once into the env record (never per run) and
embedded once at the top level of the export payload, which self-documents its
consent state (
consent.dataCollection). - Class-level device detail (GPU class/vendor, cores, memory, capabilities) is always included; CSV exports are class-level only (no fingerprint field by construction).
- Format roles (amendment A22, schema v2; extended by A23): the JSON payload
is the complete record — per-run
stats(median, p95, stddev, CI95, … derived from the measured slice at export time) plus the raw per-inference timing arrays (allTimesMs/measuredTimesMs— every warmup and measured sample), model outputs (predictions,imageVerdicts) and validity flags, with the machine context (environment, gatedfingerprint) embedded once at the top level (no per-run copies). The CSV is the compact plotting summary — one row per run with the derived aggregates (median_ms,p95_ms, …), run context and coverage/hardware-leverage columns; skipped combos stay one data-point row each. Per A23 the CSV also carries the raw measured samples (measured_times_ms, ';'-joined, unrounded), making it the self-sufficient collection artifact — the single file a device needs for every plot, distributions included. - The export gate lives in
buildExportPayload(single choke point). The headerConsentSwitchon the Capabilities page is the switch's only setting UI and governs every export surface without its own toggle: the Capabilities page export, the Results page export (JSON + CSV), and the direct Export JSON/CSV buttons on the Bench page. One exception: the Bench page end-of-sweepExportModalcarries a per-export toggle ("Include fingerprint in this export") seeded from the global switch that affects only that dialog's JSON download and never changes the global state. Automation sessions (?auto=1) are pinned to fingerprint-free artifacts. - Results-table row semantics: hiding a row (eye toggle) is session-local display state — hidden rows stay dimmed in the table and are still included in every export; the filter pills DO restrict exports to the filtered set; deleting a row removes it from IndexedDB and all future exports.
- Rationale: the server receives the full UA header on any visit regardless, so consent scope is correctly limited to artifact content.
Automated benchmark (/bench)¶
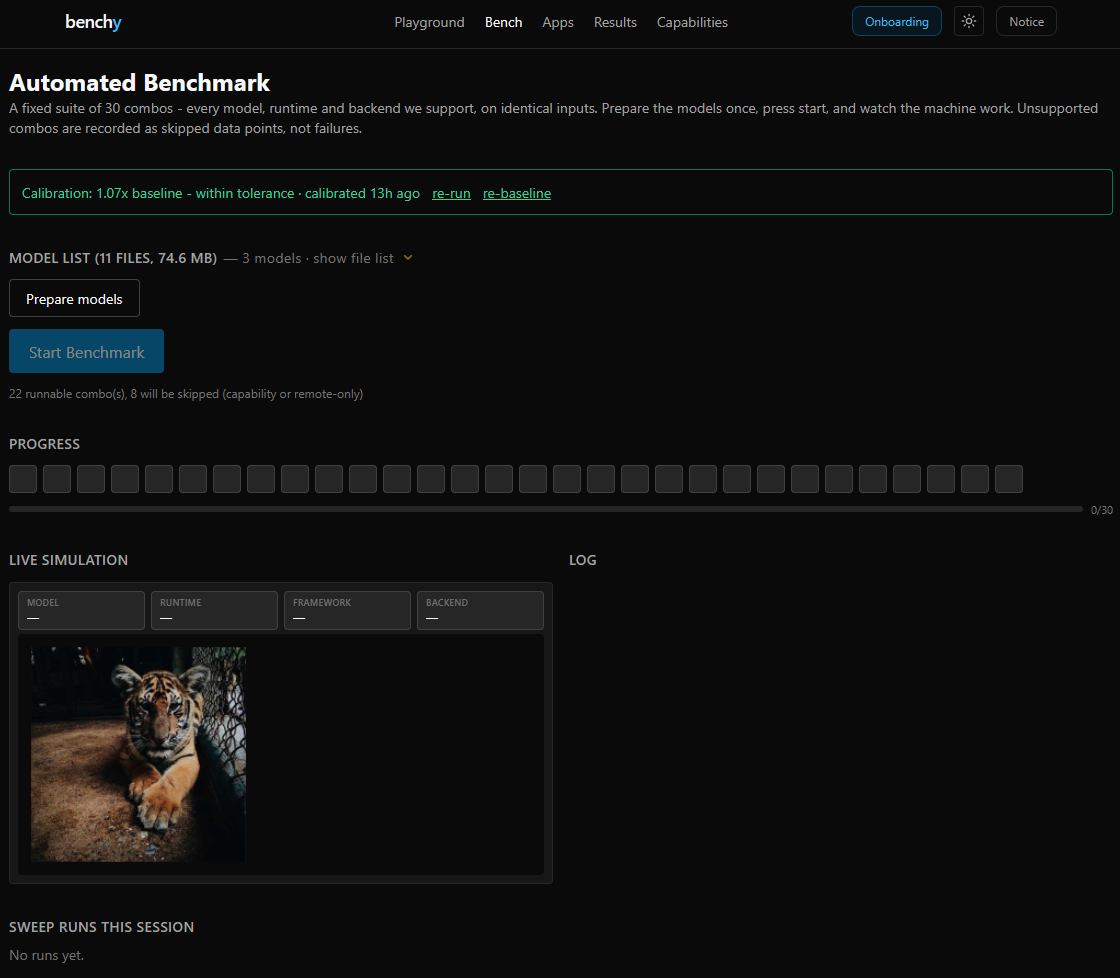
The Bench page runs the whole frozen suite hands-free; on-device operation steps
live in research/device-validation-protocol.md (per-device checklists and pass
criteria). What a run does:
- Capability probe — runs automatically on first visit (splash with phase progress; results persist to IndexedDB with 24 h staleness). It decides which engine × backend combos the page offers.
- Calibration gate — a synthetic matmul workload establishes the machine's
baseline during the first-visit capability check (so the Capabilities page
shows it immediately); every
/benchmount re-measures against that stored baseline and warns outside ±2×; a throttled/backgrounded tab disables the button instead of producing corrupted numbers. Re-run / re-baseline manually. - Prepare models — downloads every suite artifact into the Cache API
(
mlbench-models-v1) with per-file byte progress and elapsed timer; Start stays disabled until all artifacts are cached, so model load times are cache-warm. - Start Benchmark —
sweepRunnerexecutes the frozen combos sequentially. Live view: progress grid (per-combopending/running/done/skipped/error), TaskCanvas (top-5 prediction bars for the most recent inference), log panel. Unsupported combos are recorded asskipped(Detect & Report), never dropped. While sweeping, Skip combo records the current combo asskipped (manual-skip)and moves on, and Stop abandons the remaining combos; a combo that never settles (hung engine init) is auto-skipped after 2 min (skipReason: timeout). Guards never terminate the sweep with an exception — every started combo produces a row, so partial sweeps stay exportable. - Export — end-of-sweep modal: CSV or Zod-validated JSON, environment block optional, per-export anonymize override strips the device fingerprint.
Frozen suite (amendments A18/A19)¶
- 30 combos, capability-gated at runtime: ONNX Runtime Web 4 model variants (mobilenet-v2 f32 13.5 MB and i8 3.6 MB, squeezenet-1.0, efficientnet-lite0) × wasm/webgpu/webnn; LiteRT.js 4 variants × wasm/webgpu/webnn; TensorFlow.js 2 variants × wasm/webgl/webgpu. Segmentation is deliberately playground-only (single MediaPipe path, no ground-truth masks — auto-bench inclusion rule).
- Protocol per combo: one model load, then 5 warmup inferences pinned to the first image slot (warmups never advance the rotation), then 30 measured inferences rotating over the 3 bench images (tiger / dog / lioness — 10 per slot). ImageNet-standard resize-256/center-crop-224 preprocessing.
- Statistics: median (p50) and p95 over the measured slice only (warmups are
timed into
allTimesMsbut excluded from every stat);firstInferenceMsis the first timed sample (shader/JIT compile cost). TensorFlow.js wasm is pinned to the single-threaded SIMD binary (WASM_HAS_MULTITHREAD_SUPPORT = false): the threaded-SIMD path builds a pthread worker from minifiedtoString()output and hangs production builds; the pin makes dev/prod identical and deterministic across devices (applies to tfjs and ml5 via the shared tfjs instance). - Correctness: per-slot majority top-1 against registered ground truths →
imageVerdicts→ accuracyAt1 (fraction correct). Composite score = latency score × accuracyAt1 — a fast model with wrong predictions scores 0. - Validity flags (
prediction-mismatch, tab visibility, backend truth-report) annotate runs; results are never silently dropped. Result schema:research/sections/bench-schema.ts(mirrors the Zod schema).
Layout¶
The source tree is documented once, in the repo's benchy/README.md (§ Layout) —
kept out of this page to avoid drift. In short: src/core/ is pure TypeScript
(schema, tasks, runtimes with worker offload, capability, privacy, bench,
registry), src/automation/ is the URL-param driver shared by the UI and
Playwright, and e2e/ holds the Playwright specs.
How to Run¶
cd benchy
bun install
bun run dev      # dev server (COOP/COEP headers; /hf proxy for zoo models)
bun run test     # vitest
bun run e2e      # playwright (chromium)
Connection to thesis¶
- Chapter 3 (Methodology): measurement procedure, capability gating, validity flags
- Chapter 3a (Implementation): runtime adapters, capability subsystem, offline self-hosting
- Appendix: benchmark result schema (
bench-schema), browser compatibility tables